
Mobile-Ready
Only Entirely Open-Source BI
Innovative Analytical Engines
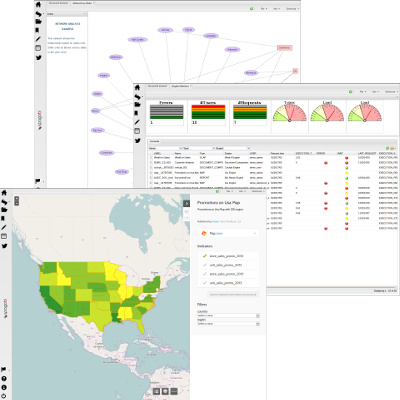
Geospatial Analytics
Overview
SpagoBI is the only entirely Open Source Business Intelligence suite. It covers all the analytical areas of Business Intelligence projects, with innovative themes and engines.SpagoBI allows you to constantly monitor your business data and processes through a dynamic and flexible approach. New business opportnuities are easily identified, while inefficiencies and bottlenecks are proptly faced.Results are then visualized through intuitive and rich business analytics (e.g. reports, KPIs, interactive charts) for informed decision-making, even combining historical data with real-time data.
SpagoBI integrates the real-time technology available in the specialized 100% open source eBAM – eclipse Business Activity Monitoring (BAM) – component, released on Eclipse Foundation.
Monitor your business process and customize your real-time analytics no matter where you are, thanks to SpagoBI for mobile.you can explore any data from your tablet and smartphone, through interactive reports, dashboards and cockpits. Characterized by an entirely web-based and touch-enabled front-end, SpagoBI mobile enables:
- User authentication
- Role-based document and data access
- Data update
- Scheduled analysis
- Periodical and automatic access to identify possible alarms and notifications.

Reporting & Charts
Realize structured reports and export them using the most suitable format (HTML, PDF, XLS, XML, TXT, CSV, RTF).
Develop ready-to-use charts according to your single charts (e.g. histograms, pie charts, bar charts, area charts, scatter diagrams, line charts, bubble charts, dispersion charts) and interactive ones (e.g. temporal sliders, add/delete series). Use it separately or aggregate them into a cockpit for a richer view on your data!
Multidimensional analysis (OLAP) & KPIs
Expore your data on different detail levels and from different perspectives, through drill-down, drill-across, slice-and-dice, drill-through processes.
SpagoBI offers a complete set of tools to create, manage, view and browse KPI hierarchy models, through different methods, calculation rules, thresholds and alarm rules.

Interactive cockpits & Location Intelligence
Aggregate different analysis into a single view, set navigation paths, and explore your data a dynamic and graphical way.
Visualize your business data on maps (i.e. static map catalogues or web mapping/feature services) and interact dynamically to get instant views.
Data mining & Network analysis
Advanced data analysis allowing you to extract knowledge from large volumes of data, to improve your decision-making and business strategies.
Visualize and interpret relations among entities through specialized views. An entity can be animate (e.g. social media users) or inanimate (e.g. countries, companies, projects).

Collaboration & Office automation
Create structured report dossiers, enrich your analysis with personal notes and comments posted by users. Then share them through a collaborative work-flow.
Publish your personal documents into your BI environment, integrating common Office tools (Open Office or MS Office).
Masterdata management & External processes
Users can write back to the database and modify table data through an intuitive user interface, whose behavior can be set by means of simple configuration parameters, using pre-defined models.
Manage your analytical processes, which can run in the background or be scheduled to start and stop at a scheduled time.